
Reporting
You can run a report for your team and export the details for all users, a single user, by role, or by least active users.
To run a team activity report, follow these steps:
-
Go to the Activity tab.
NOTE: Activity reports are not available under the portal tab.
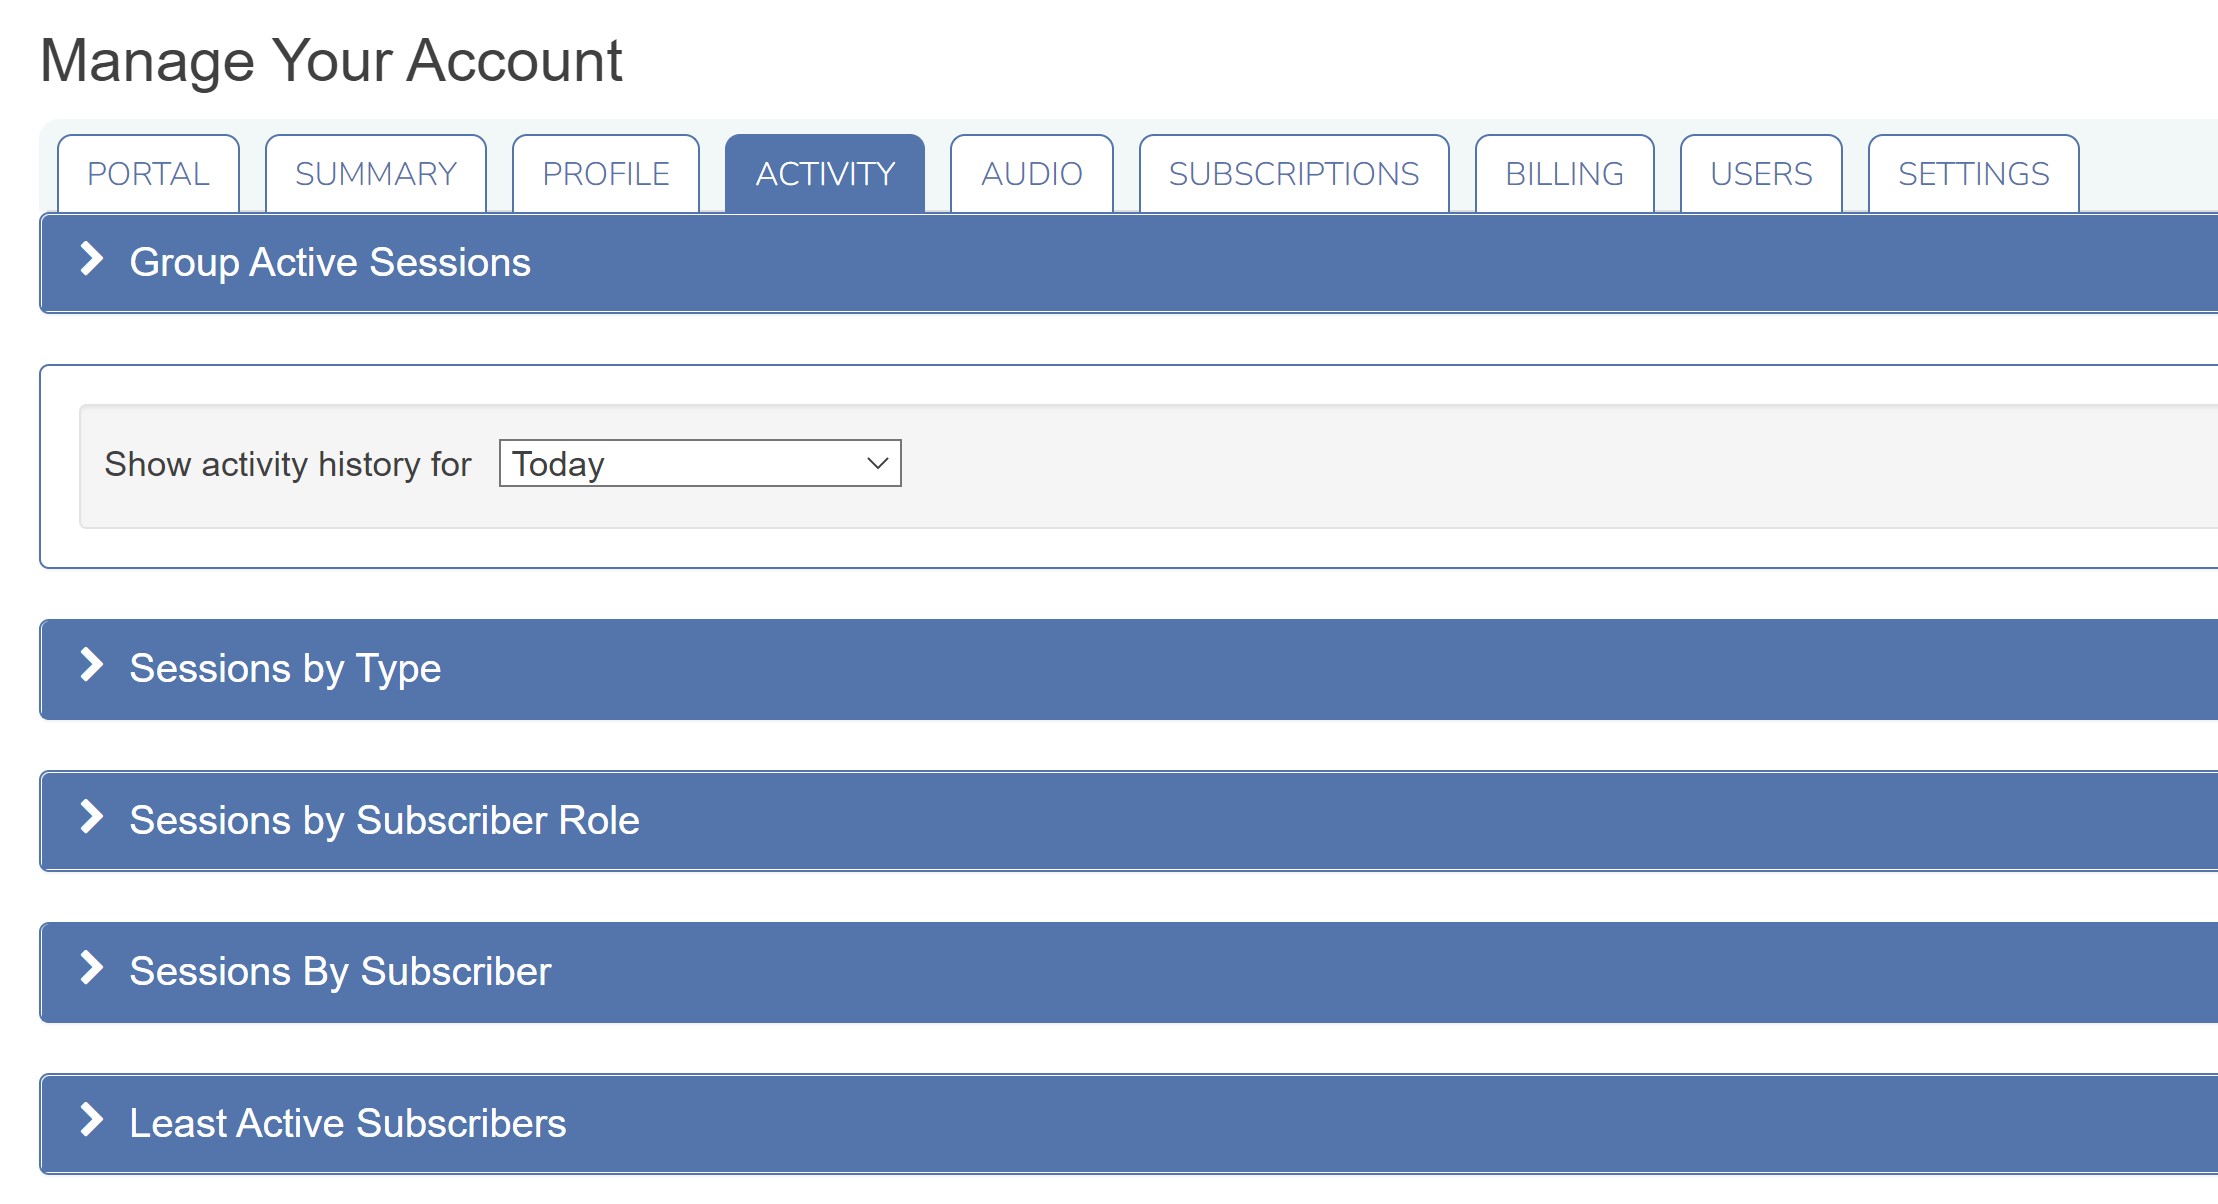
-
When you click on the Activity tab, it will automatically provide you a team session report for today.
-
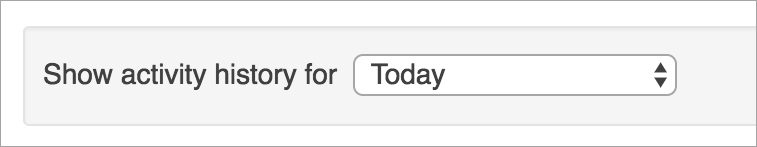
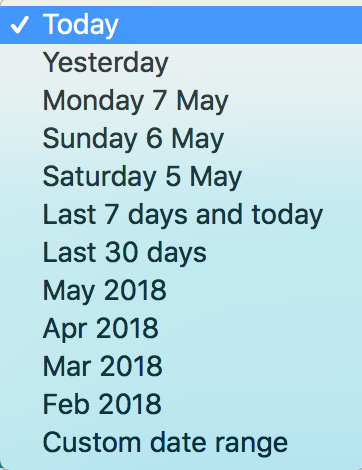
You can change the date range of the session report to:

- Today
- Yesterday
- Last 7 days
- Current month report
- Last month's report
- Two months ago
- Three months ago
- Four months ago
- Custom date range

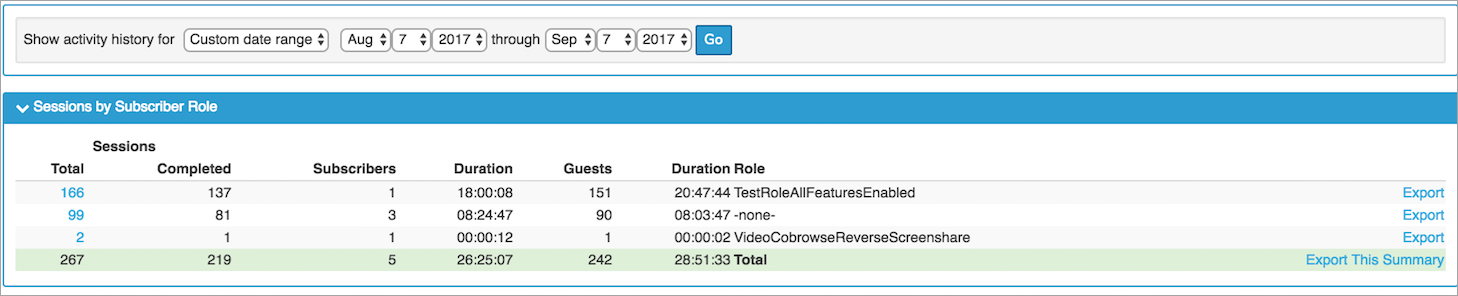
Here is an example of selecting a Custom Date Range

-
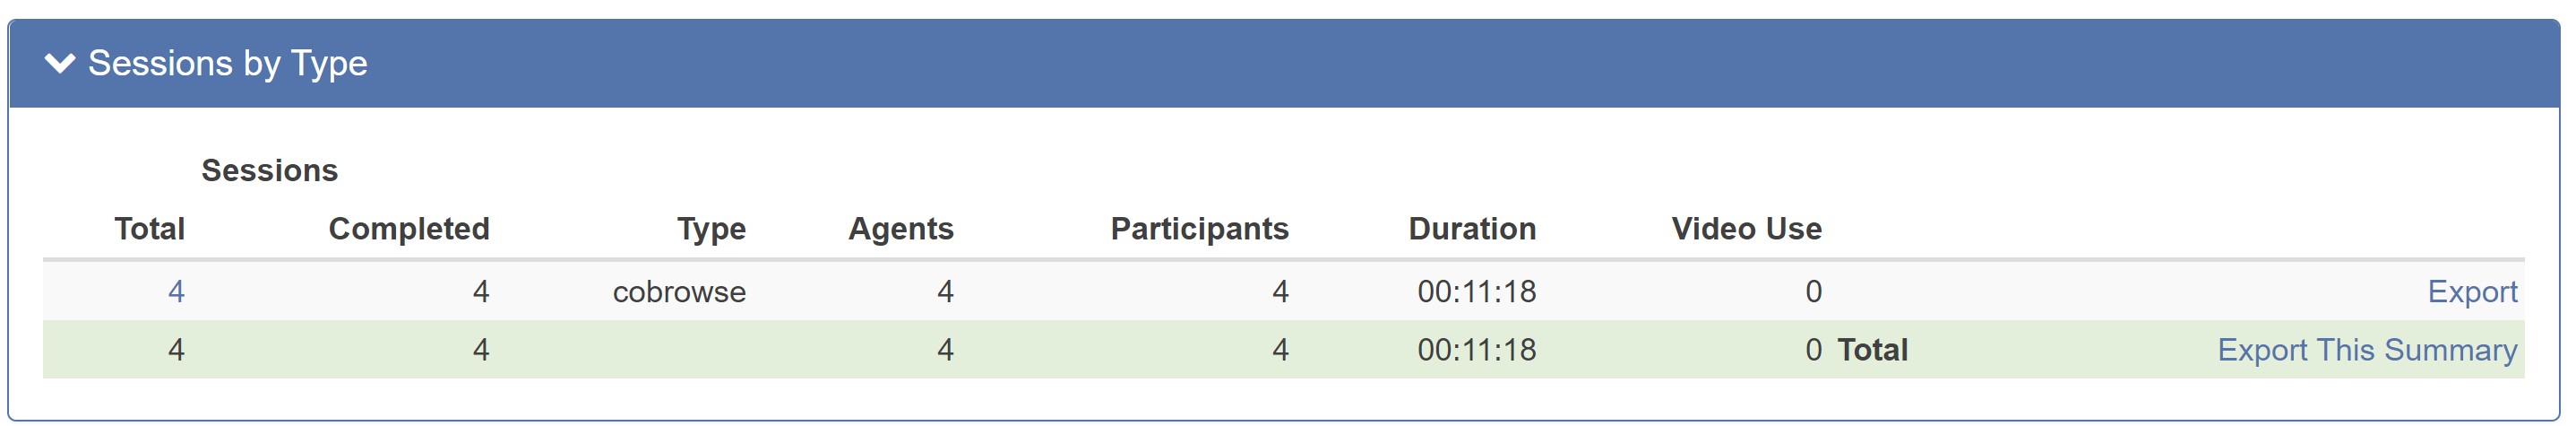
Sessions by Type: You can Export the report via type or all. Click on the Total number to see a breakdown of each session. You can see the duration, how many participants, if video or screenshare was used, etc.
-
Sessions by Subscriber Role: You can Export the report via role or summary of all roles.
-
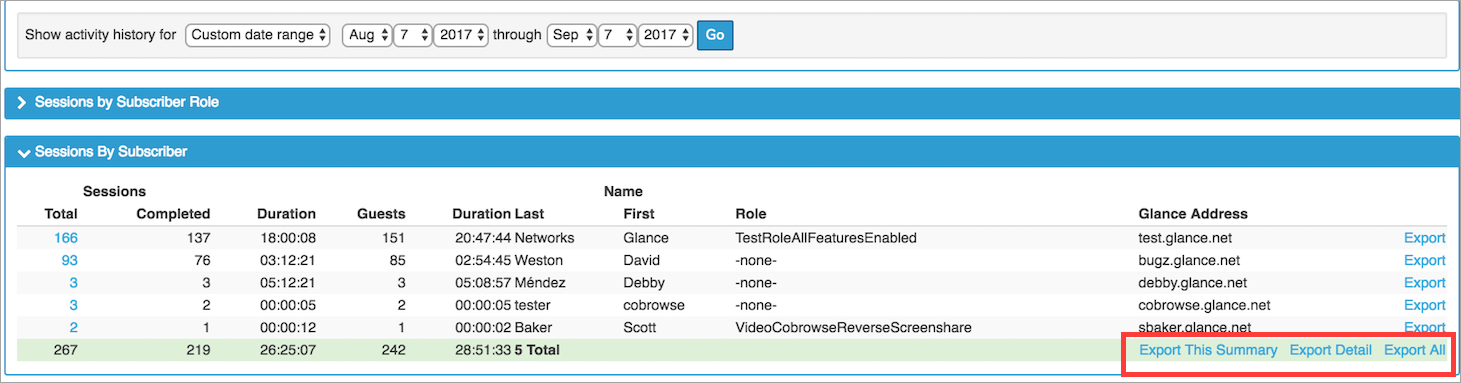
Sessions by Subscriber: You can Export the report by single subscriber, all, or summary.
-
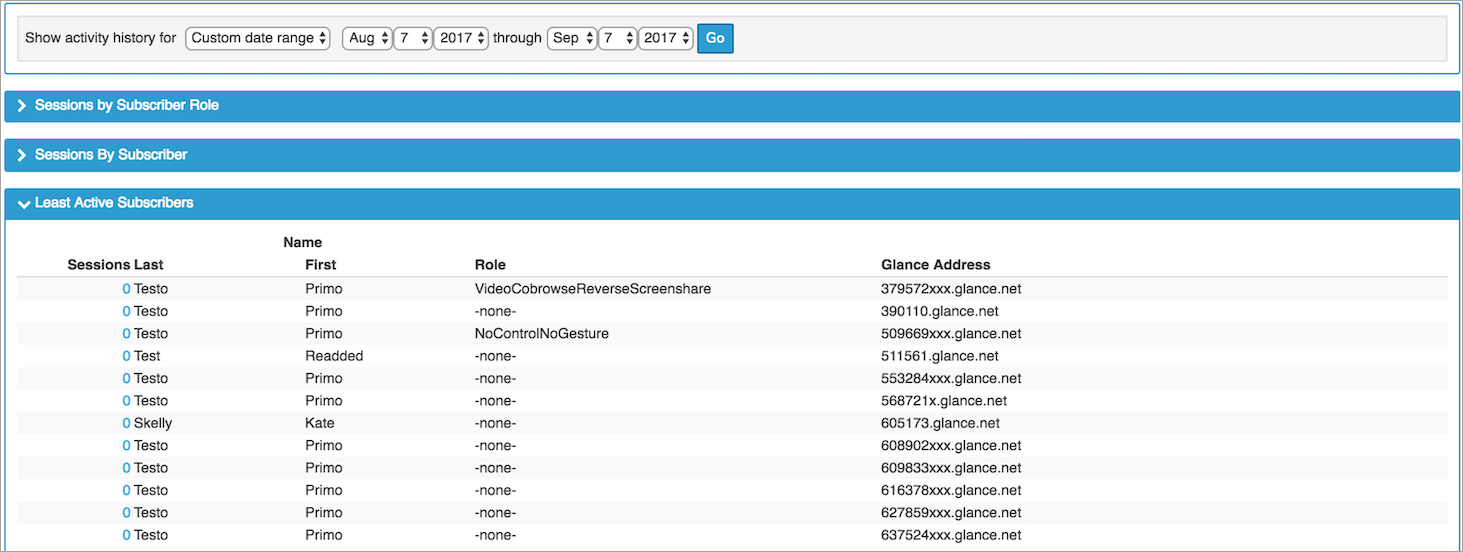
Least Active Subscribers (No sessions or low 5%): You can Export all or summary.


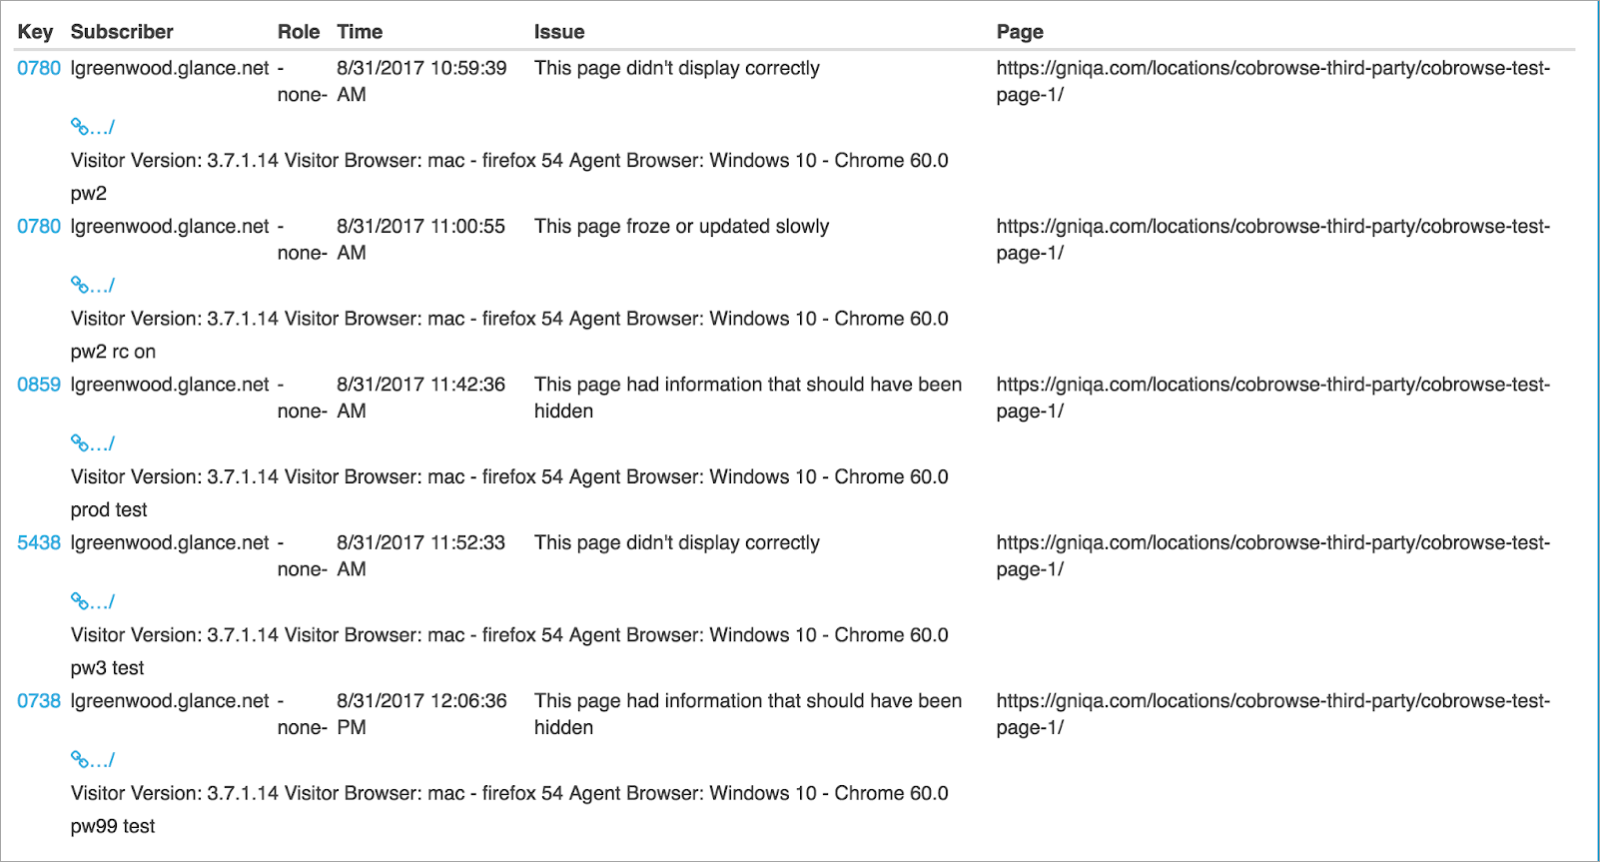
Report Session Problems (For Cobrowse Only)
This feature is enabled for Cobrowse only, agents may report any oddities while cobrowsing. Some examples include: page loaded slowly, screen froze, and I didn't see the images the customer was seeing. By reporting session problems, Glance can help troubleshoot with you to improve your agent/customer experience.
Events are also added through the AddCallReport API when an agent navigates to an unapproved website during a session.
To use Session Problem Reports:
- Under the Activity tab, select the Session Problem Reports.
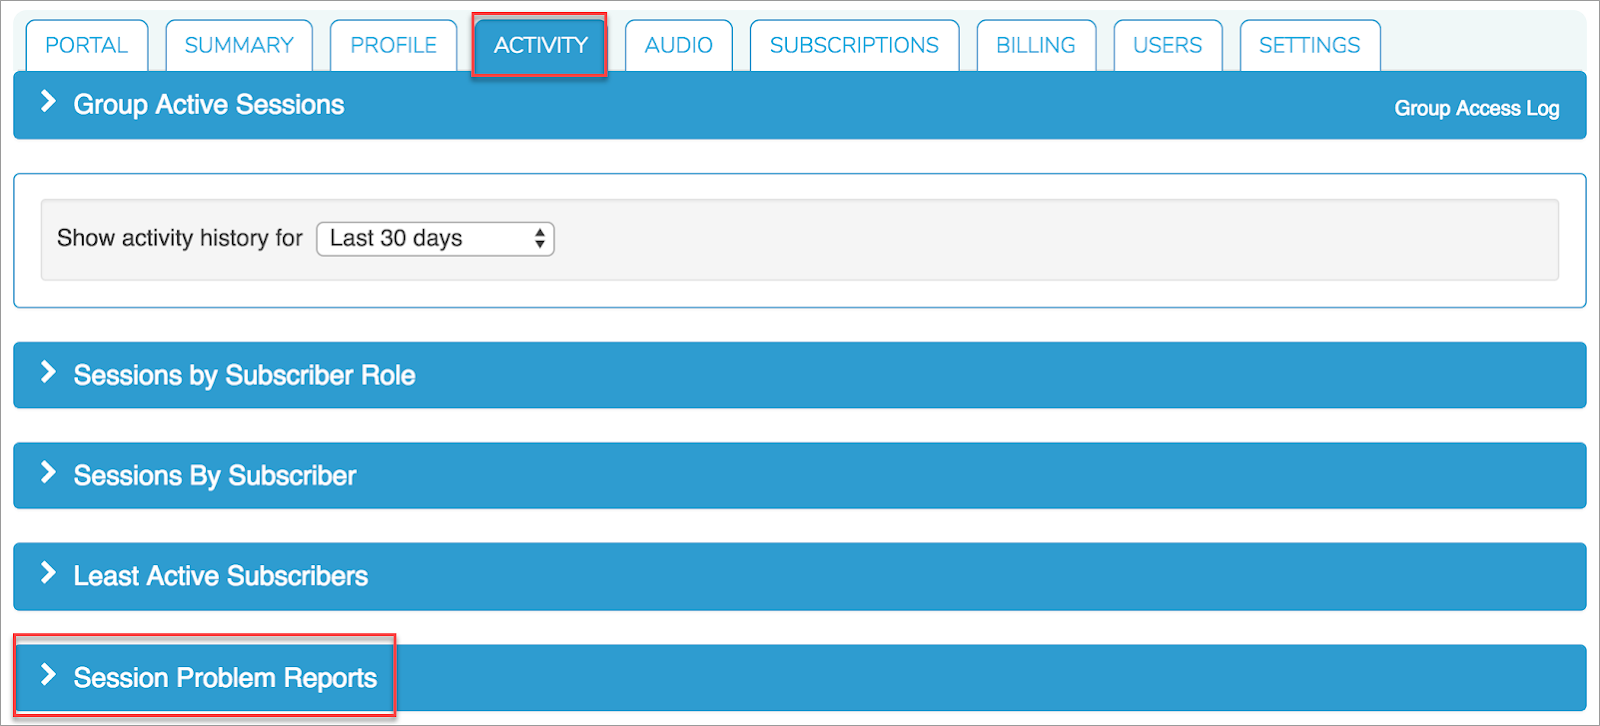
NOTE: If no problems have been reported, the Session Problem Reports section will not be visible.
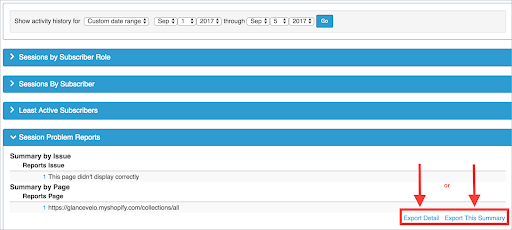
- Once you have expanded the Session Problem Reports section, the report will automatically display the last 30 days. It is broken down into two sections:

- Summary by Issue: To view the summary of an issue, click on the Number to the left of the issue. Once clicked, it will return a summary on this single issue.
- Summary by Page: To view the summary of a specific page, click on the Number to the left of the page issue. Once clicked, it will return a summary of the issues on that particular page.
The summary will look like this:
Export Reports
To get the most out of the data, Glance recommends exporting the details into a CSV (comma-separated values) file. You can view and analyze CSV files with Excel or another spreadsheet program.
After you have run the report, click Export Detail or Export The Summary.
Reporting Tab Overview
Reporting Tab Overview If you have access to the REPORTING tab, you can view dashboards of your session data to better understand how your organization is using Glance.
Overview Section
The overview section provides a high-level view of Glance session and license data.
Purchased Licenses: The count of licenses your organization has purchased. Glance refreshes purchased license data monthly.
Provisioned Licenses: The number of unique active accounts in a client group.
Completed Sessions: This Month: The count of completed sessions that occurred this month. A completed session is when both parties join the session for a period of time.
Available Licenses: The count of purchased licenses minus provisioned licenses. A negative number indicates that you should reallocate licenses to active users.
License Utilization: Last 12 Months: The monthly average of active users divided by the number of purchased licenses.
Completed Sessions: All Time: The count of completed sessions since you have been a Glance Customer. A completed session is when both parties join the session for a period of time.
Utilization Breakdown
The utilization breakdown section provides data on how many users completed sessions over time.
Usage Breakdown
The usage breakdown section provides data on how many sessions have occurred over time.
Leaderboard
The leaderboard section provides details on how your agents are using Glance.
Saving and Sharing Data
- To save the entire dashboard, from the gear icon in the top-right corner, click Download as PDF or Download as CSV.
- To share the entire dashboard in an email, from the gear icon in the top-right corner, click Send.
- Enter email addresses of users you want to receive the email.
- Choose the type of format for the attachment: PDF, Visualization, or CSV ZIP file.
- Click Send.
- To schedule a recurring email of the dashboard, click Schedule.
- Enter a name for the schedule.
- Enter email addresses of users you want to receive the email.
- Choose the type of format for the attachment: PDF, Visualization, or CSV ZIP file.
- Choose the time and frequency for the email.
- Click Save All.
- To save data from an individual chart in XLSX format, click the three dot menu in the top-right corner of the chart, and click Download Data.
- For any questions about reporting data, contact your Glance account representative.